Week in freight ending 7/26/2026
The Cargo Exchange17 min read
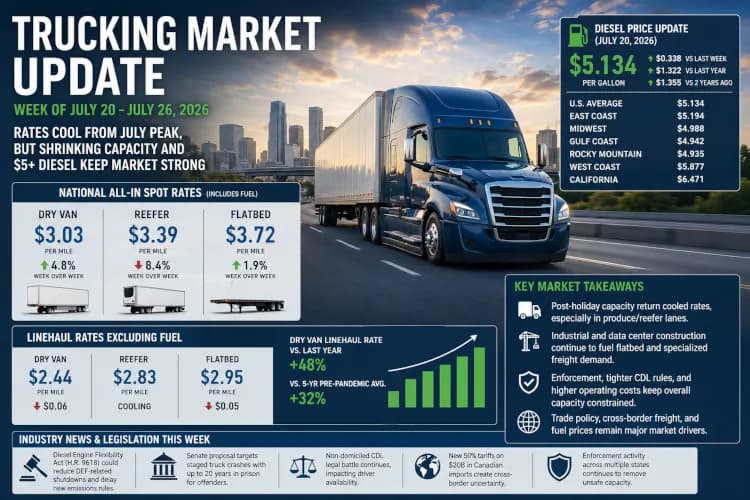
The Week in Freight: Trucking Market Report for July 26, 2026
Freight Rates Remain Historically Strong, but the Post-Holiday Market Is Beginning to Cool
The U.S. trucking market entered the final week of July with two competing forces shaping freight prices.
On one side, truckload capacity remains significantly tighter than it was one year ago. Carrier exits, stricter driver and equipment enforcement, elevated operating costs, and the movement of trucks toward contract freight have all reduced the number of trucks available in the spot market.
On the other side, freight activity is moving past its early-summer seasonal peak. Produce volumes are easing, equipment is returning after July safety inspections, and load postings declined across dry van, reefer, and flatbed markets during the latest reporting week.
The result is a freight market that softened slightly week over week but remains considerably stronger than it was during the summer of 2025.
The biggest immediate concern for carriers is fuel. The national diesel average climbed sharply to $5.134 per gallon on July 20, increasing 33.8 cents in one week and standing $1.322 per gallon higher than one year earlier.
That jump raises operating costs immediately, even when freight rates do not rise at the same pace.
Truckload Spot Rate Snapshot
Two types of rates appear throughout freight-market reporting:
All-in spot rates generally include the fuel surcharge.
Linehaul rates exclude fuel and provide a clearer measurement of the underlying transportation market.
Both are useful, but they should not be compared as though they represent the same thing.
Current All-In National Spot Rates
For the week of July 13 through July 19, national average spot rates were approximately:
Equipment typeAverage all-in spot rateDry van$3.03 per mileRefrigerated$3.39 per mileFlatbed$3.72 per mile
Dry van spot rates increased approximately 4.8% week over week, flatbed rates increased about 1.9%, and reefer rates declined approximately 8.4% as refrigerated capacity returned after the Fourth of July produce rush.
These averages include a substantial fuel component. Carriers should not interpret a $3.03 all-in dry van rate as $3.03 in usable linehaul revenue.
Current Linehaul Rates Excluding Fuel
DAT’s seven-day linehaul measurements showed:
Equipment typeNational linehaul rateWeekly changeDry van$2.44 per mileDown $0.06Flatbed$2.95 per mileDown $0.05ReeferApproximately $2.83 per mileCooling after the early-July peak
The national dry van linehaul rate remained 48% higher than the same period last year and approximately 32% above the five-year non-pandemic seasonal norm.
Flatbed linehaul rates remained 44% higher year over year and approximately 32% above their non-pandemic five-year baseline, despite the small weekly decline.
Reefer pricing weakened more noticeably during the week as produce capacity loosened. Even after that decline, most comparable produce lanes remained approximately 30% to 70% higher than July 2025, with some citrus lanes posting even larger annual increases.
Dry Van Market: Rates Retreat From the Peak but Remain Extremely Strong
The national dry van linehaul rate declined by 6 cents per mile to $2.44 after reaching a historic seasonal high the previous week.
This appears to be a normalization rather than a collapse.
Dry van load postings declined approximately 9% during the week, while truck postings increased about 1% as equipment returned following recent commercial-vehicle safety inspections. The national dry van load-to-truck ratio fell approximately 10% to 10.07 loads per posted truck.
Although the ratio declined, it still represents a much tighter market than carriers experienced during much of the freight recession.
Load postings also remained approximately 33% higher than one year earlier, while available equipment had not fully recovered to pre-July Fourth levels.
What Is Supporting Dry Van Demand?
The surprising development is that stronger freight demand is not primarily coming from household consumer goods.
DAT reported that seasonally adjusted truck ton-miles increased 0.7% month over month and 1.4% year over year in May. The strongest growth was concentrated in industrial and technology-related categories:
Professional and commercial equipment increased 11%.
Electrical-goods freight increased 28.3%.
Machinery and equipment freight increased 5.3%.
Primary metals and machinery manufacturing also strengthened.
Meanwhile, furniture, paper, wood products, beverages, and other consumer- or housing-related freight categories remained soft.
This means the current dry van recovery is uneven.
Industrial investment, electrical equipment, and data-center construction are producing meaningful freight, but broad consumer demand has not yet produced the same level of growth.
Market Effect
Dry van carriers continue to have more negotiating power than they had last summer, particularly in industrial markets and Midwest corridors.
However, carriers should not assume every region is equally strong. Rates could remain elevated nationally while certain consumer-heavy or import-dependent lanes become softer.
Brokers should expect more resistance from carriers on short-notice freight, undesirable delivery locations, and loads that lack adequate fuel compensation.
Reefer Market: Produce Season Is Cooling
Reefer freight experienced the most visible weekly correction.
After a period of tight refrigerated capacity surrounding the Fourth of July, trucks returned quickly to major produce regions. USDA availability classifications loosened across California, Georgia, Florida, and South Texas.
Several California districts moved from a slight truck shortage to adequate capacity. The Georgia and Florida tomato-and-watermelon region moved from shortage conditions toward adequate or slightly tight capacity, while South Texas reached surplus capacity.
Rates responded immediately.
Many Georgia and Florida produce lanes into the Northeast declined between 19% and 29%. Santa Maria outbound rates to Boston declined approximately 10%, while rates to Philadelphia fell roughly 7%.
Why the Market Weakened
The reefer decline is primarily seasonal:
The Fourth of July shipping rush has passed.
Georgia and Florida watermelon and tomato activity is slowing.
California’s navel orange season is nearly complete.
Nogales mango shipments have ended for the season.
More refrigerated trailers are available again.
The important point is that reefer rates are falling from a very elevated level.
The market is not returning to the weak conditions of July 2025. Comparable produce lanes remain substantially more expensive than they were one year ago.
Market Effect
Reefer carriers should expect more lane-specific volatility.
Produce origins that were extremely tight earlier in July may no longer support the same rates. Carriers that price based only on what a lane paid two weeks ago could lose loads or position equipment into a cooling market.
Brokers should have more room to negotiate than they did around the holiday, but they should not expect rates to return to 2025 levels. Elevated fuel and reduced industrywide capacity continue to create a high pricing floor.
Flatbed Market: Industrial and Data-Center Freight Remain Major Supports
Flatbed linehaul rates declined by 5 cents to $2.95 per mile, but the market remains historically strong.
The national flatbed load-to-truck ratio declined approximately 15% to 44.07 as equipment postings increased 8% and load postings declined 8%. Even after that weekly reduction, flatbed load volume remained approximately 48% higher than one year earlier.
The largest source of longer-term optimism is industrial construction tied to artificial intelligence and data centers.
Data-center projects require enormous quantities of:
Structural steel
Concrete-related equipment
Transformers
Switchgear
Generators
Cooling equipment
Batteries
Oversized electrical components
DAT estimates that one gigawatt of new data-center capacity can require roughly 100,000 truckloads of construction and electrical materials. Approximately 20 gigawatts built since 2023 may already have generated around 2 million truckloads.
Announced projects for 2026 and 2027 could represent millions of additional truckloads, although many projects remain subject to delays, power shortages, permitting problems, or cancellation.
Market Effect
Flatbed demand has a stronger industrial foundation than dry van or reefer demand, but it is highly regional.
Carriers near active data-center, energy, manufacturing, and infrastructure projects may see sustained pricing strength. Carriers should focus on actual construction starts rather than relying on announcements alone.
Brokers should be careful about committing long-term pricing in regions with active industrial construction. A project can absorb local flatbed, step-deck, heavy-haul, and specialized capacity quickly.
Diesel Fuel Prices: The Biggest Immediate Threat to Carrier Margins
The national average on-highway diesel price reached $5.134 per gallon on July 20, 2026.
That represented:
A weekly increase of $0.338 per gallon
An annual increase of $1.322 per gallon
A two-year increase of $1.355 per gallon
Regional averages were:
RegionDiesel priceU.S. average$5.134East Coast$5.194Midwest$4.988Gulf Coast$4.942Rocky Mountain$4.935West Coast$5.877California$6.471
The Lower Atlantic region, which includes much of the Southeast, averaged $5.107 per gallon, up 35.9 cents in one week.
What Higher Diesel Means Per Mile
A truck averaging 6.5 miles per gallon consumes approximately 0.154 gallons per mile.
At $5.134 per gallon, its gross fuel cost is approximately:
$5.134 ÷ 6.5 MPG = $0.79 per mile
At 7.5 MPG, the cost is approximately:
$5.134 ÷ 7.5 MPG = $0.68 per mile
A carrier running 2,500 miles per week could therefore spend roughly $1,710 to $1,975 per week on diesel, depending on fuel economy.
That does not include reefer fuel, idling, tolls, maintenance, insurance, truck payments, wages, factoring, or deadhead.
Market Effect
Fuel is helping keep all-in freight rates high, but it does not automatically improve carrier profitability.
A load paying $3.00 per mile all-in may provide only about $2.20 to $2.30 per mile before fuel after accounting for the current diesel cost. Deadhead reduces the effective rate further.
Contract carriers often receive more reliable fuel-surcharge protection than spot carriers. That is encouraging some capacity to move toward contract freight, leaving fewer trucks available on load boards and supporting spot prices. DAT previously identified that capacity shift as an important reason spot rates rose even while freight volumes declined.
Carriers should separate fuel from linehaul during negotiations and calculate revenue across every dispatched mile, not only loaded miles.
Carrier Capacity Is Still the Market’s Most Important Structural Factor
The freight recovery remains heavily influenced by reduced truck supply.
During May, DAT recorded rising spot rates even as truckload volume declined:
Van volume fell 9% month over month.
Reefer volume fell 10%.
Flatbed volume fell 14%.
Despite those declines, May’s all-in spot rates rose to:
$2.89 per mile for dry van
$3.35 per mile for reefer
$3.65 per mile for flatbed
DAT attributed the increase primarily to tighter capacity, driver attrition, inspection activity, elevated fuel costs, and trucks moving toward contract freight.
July’s weekly decline does not reverse that structural trend.
More trucks became available after the holiday and inspection period, but the overall carrier base remains significantly tighter than it was one year ago.
Large carriers are also reporting stronger fundamentals. Knight-Swift said truckload conditions improved rapidly during the second quarter and could strengthen further beginning in September and through peak season.
Market Effect
The industry is not experiencing a broad freight boom in which every type of demand is increasing.
Instead, the market is being supported by:
Fewer available trucks
Higher fuel and operating costs
Increased enforcement
Industrial and technology-related freight
Seasonal freight
Capacity shifting from spot to contract
That is enough to support higher rates, but it also makes the market vulnerable. If industrial investment slows or a large amount of capacity returns, rates could weaken even without a major decline in freight volume.
Commercial-Vehicle Enforcement Continues to Remove Capacity
State and provincial enforcement agencies expanded roadside inspection and safety activity during the week.
Inspections in Maryland, Florida, Kentucky, Illinois, Arizona, Nebraska, Oklahoma, and Ontario resulted in trucks and drivers being placed out of service for unsafe equipment, licensing concerns, and dangerous driving violations.
Enforcement affects market pricing in two ways.
First, trucks placed out of service are immediately removed from available capacity.
Second, smaller carriers may temporarily park equipment or avoid certain regions when inspection activity increases, particularly when they are concerned about maintenance deficiencies or driver-documentation problems.
Market Effect
Safety enforcement can produce short-term rate spikes even when load volumes are unchanged. Brokers may see trucks disappear from particular corridors, while compliant carriers can gain additional pricing leverage.
Over the longer term, stronger enforcement favors professionally operated carriers but increases the cost of remaining in the industry.
Non-Domiciled CDL Rules Remain a Major Capacity Issue
The legal battle surrounding non-domiciled commercial driver’s licenses continued during the week, with court filings advancing the dispute over federal restrictions and state licensing authority.
Changes to non-domiciled CDL eligibility have already contributed to concern about driver availability. When fewer drivers qualify to operate, available truck capacity contracts.
Supporters argue that stronger CDL standards improve safety and prevent unqualified drivers from operating commercial vehicles. Critics argue that abrupt restrictions can remove experienced drivers, create administrative confusion, and worsen an existing labor shortage.
Market Effect
Regardless of the political debate, tighter CDL eligibility is generally inflationary for freight rates in the near term.
A smaller driver pool means:
Fewer seated trucks
Higher recruiting costs
Higher driver wages
More parked equipment
Greater carrier leverage
Large carriers can spread those costs across bigger networks. Small carriers and owner-operators feel them more directly.
The Diesel Engine Flexibility Act Could Change Future Truck Costs
Congress is considering the bipartisan Diesel Engine Flexibility Act, introduced as H.R. 9618.
The proposal would protect revised EPA guidance designed to prevent trucks from being rapidly derated to extremely low speeds because of false or malfunctioning diesel exhaust fluid sensors.
Under newer guidance, affected trucks receive a longer warning period and can continue operating for thousands of miles before severe speed restrictions apply. The legislation would provide a 10-year legal safe harbor for manufacturers and repair providers that implement those changes.
The bill also contains a much broader provision. As written, it could prevent the implementation of emissions standards more stringent than current federal heavy-duty standards for approximately 10 years, including the 2027 heavy-duty low-NOx requirements.
Potential Market Effect
If enacted in its current form, the bill could:
Reduce unexpected DEF-related downtime
Lower the risk of trucks being stranded by faulty sensors
Reduce pressure for fleets to purchase trucks before 2027
Stabilize used-truck values
Delay some future emissions-compliance costs
Reduce uncertainty surrounding equipment purchases
For small carriers, fewer DEF-related derates could mean fewer missed loads, fewer tow bills, and less unplanned downtime.
However, the proposal is still legislation rather than settled law. Fleets should not change equipment plans until its final language and status become clear.
New Canadian Tariffs Create Cross-Border Uncertainty
On July 20, the U.S. administration announced new 50% tariffs on approximately $20 billion of Canadian imports, escalating trade tensions between the two countries.
Tariffs can increase truckload demand before implementation as importers rush shipments across the border. After implementation, they can reduce freight volumes if the added cost lowers demand or causes companies to source products elsewhere.
The effects will vary by commodity.
Cross-border automotive parts, metals, industrial goods, agriculture, forestry products, and manufacturing inputs are among the freight categories most sensitive to changes in U.S.-Canada trade.
Market Effect
In the immediate term, tariff deadlines can create temporary shipment surges and capacity shortages near border markets.
Over the longer term, higher tariffs may reduce total cross-border volume, alter sourcing patterns, or redirect freight toward domestic suppliers.
Carriers operating near Detroit, Buffalo, northern New York, Minnesota, North Dakota, Montana, and the Pacific Northwest should expect more volatility than normal.
Cross-Border Freight With Mexico Remains Strong
U.S.-Mexico cross-border freight continues to provide support for southern trucking markets.
Recent trade data showed cross-border commerce exceeding $87 billion in May, while Mexican heavy-duty truck production and exports rebounded in June in response to stronger U.S. freight demand.
C.H. Robinson has also reported tight truck capacity, border delays, and firm pricing on Mexico routes, while Canadian freight has remained comparatively softer and more exposed to trade-policy uncertainty.
South Texas reefer rates remained relatively stable during the latest weekly market correction, even as available capacity increased. Mexican crossing volume helped absorb the additional trucks.
Market Effect
Laredo, McAllen, El Paso, and other southern border markets should remain strategically important.
Carriers should still account for:
Border waiting time
Trailer interchange risk
Cargo theft
Insurance restrictions
Inspection delays
Weekend and holiday congestion
Imbalanced northbound and southbound freight
Strong crossing volume does not guarantee a profitable round trip.
Weak Housing Activity Continues to Hurt Some Freight Segments
The housing market remains a drag on consumer-oriented and big-and-bulky freight.
Lower home sales reduce demand for:
Furniture
Appliances
Mattresses
Building products
Home-improvement materials
Final-mile delivery services
FreightWaves reported that weak housing activity is hurting large-item last-mile delivery providers, forcing carriers to compete more aggressively on service, technology, and scale.
DAT’s freight data tells a similar story. Furniture, paper, wood products, and several consumer-oriented freight categories remain down year over year.
Market Effect
The freight recovery is not evenly distributed.
Flatbed demand tied to data centers may be strong while lumber or residential building-material lanes remain weak. Dry van demand tied to electrical equipment may increase while furniture freight declines.
Carriers should evaluate the industry behind each lane instead of relying only on a national rate average.
Intermodal Could Gain Freight From Trucking
Higher truckload prices and rising diesel costs are making rail intermodal more attractive to shippers.
C.H. Robinson reported that intermodal demand is gaining momentum as shippers reconsider mode choices, although rail and terminal capacity could tighten in important markets.
Intermodal is most competitive on longer lanes where transit times are flexible and the shipper can save enough to justify additional handling.
Market Effect
Truckload carriers could lose some long-haul, price-sensitive freight to rail.
However, stronger intermodal demand also creates local trucking work involving:
Drayage
Container pickup and delivery
Rail-ramp transfers
Warehousing
Transloading
Final-mile transportation
The effect will depend on lane length, service requirements, and rail capacity.
Fraud and Cargo Security Remain Serious Industry Risks
A cross-border investigation announced during the week uncovered an alleged broker-style transportation operation linked to a major drug seizure involving suspected cocaine and methamphetamine.
Although criminal smuggling operations are separate from ordinary freight brokerage, the case highlights the continuing risk surrounding cross-border identities, carrier vetting, trailer custody, and shipment documentation.
Cargo theft and fraudulent carrier activity can tighten legitimate capacity by increasing:
Insurance premiums
Verification requirements
Broker onboarding time
Tracking requirements
Restrictions on high-value commodities
Market Effect
Verified carriers with strong safety records, consistent tracking, established authority, and clean documentation are becoming more valuable.
Brokers that rely on weak verification or rate-first carrier selection face growing financial and legal exposure.
New Proposal Targets Staged Commercial-Truck Crashes
A Senate proposal introduced during the week would establish federal criminal penalties for people who organize or participate in staged commercial-vehicle crashes. Convictions could result in prison sentences of up to 20 years in serious cases.
Staged crashes contribute to rising liability costs and so-called nuclear verdict concerns across the trucking industry.
Market Effect
The proposal would not immediately lower insurance rates, but stronger federal penalties could discourage organized crash schemes and improve prosecutors’ ability to pursue them.
Insurance remains one of the largest barriers to entry for small carriers. Any meaningful reduction in fraudulent claims could eventually improve carrier operating costs, although that effect would likely take years rather than weeks.
Technology and Autonomous Freight Continue Advancing
Aurora reported nearly 440,000 driverless miles and is moving toward broader production scale using new autonomous-truck hardware.
Technology providers are also introducing more automated freight-execution and carrier-management systems. J.B. Hunt worked with Overroute on an AI-based freight-execution platform designed for enterprise carriers.
Market Effect
Autonomous trucks are not currently adding enough capacity to materially lower national spot rates.
Their near-term influence will be concentrated on repeatable highway corridors, particularly hub-to-hub operations in the Southwest and southern United States.
Freight technology is likely to affect pricing sooner than fully autonomous trucks by improving:
Load matching
Route planning
Bid management
Empty-mile reduction
Carrier verification
Appointment management
Freight tracking
Better technology can increase efficiency, but it does not eliminate the cost of fuel, equipment, labor, insurance, or compliance.
What Carriers Should Expect Next
The market appears to be moving from an extreme early-July seasonal peak into a more balanced but still carrier-favorable environment.
Carriers should expect:
Dry van rates to remain strong but lane-sensitive
Reefer rates to soften further as produce capacity loosens
Flatbed rates to remain supported by industrial construction
Fuel to place continued pressure on margins
Safety enforcement to remove marginal capacity
Border markets to remain volatile
Contract freight to compete with the spot market for trucks
Higher operating costs to keep rate floors above 2025 levels
Carriers should not mistake high all-in rates for high profit. At more than $5 per gallon for diesel, loaded rate, deadhead, fuel economy, dwell time, tolls, and reload availability all matter.
What Brokers and Shippers Should Expect Next
Brokers and shippers should not assume that the latest weekly decline represents a return to cheap capacity.
The market has loosened from the July peak, but carrier supply remains constrained and operating costs remain elevated.
Brokers should expect:
More negotiating room on produce freight
Continued resistance on undesirable dry van and flatbed lanes
Higher costs for short-notice and weekend freight
Strong pricing in industrial and data-center construction regions
Fuel-related rate adjustments
Greater demand for fast payment and fuel advances
More carrier scrutiny of broker credit and payment history
Shippers should strengthen routing guides, secure reliable capacity earlier, and avoid using outdated 2025 rate expectations.
Freight Market Outlook
The trucking market as of July 26, 2026 is stronger than it was one year ago, but the strength is not being created by a broad consumer boom.
The rate recovery is being driven by a combination of:
Reduced carrier capacity
Driver and equipment enforcement
Elevated diesel prices
Contract-market migration
Cross-border freight
Industrial manufacturing
AI and data-center construction
Seasonal produce activity
The weekly numbers show a normal post-holiday correction. Dry van and flatbed rates declined slightly, while reefer rates fell more sharply as refrigerated equipment returned.
However, all three equipment categories remain far above last year’s pricing.
The most likely near-term scenario is continued volatility rather than a straight move upward or downward. Rates may soften in certain seasonal markets while remaining exceptionally strong in industrial, border, and capacity-constrained regions.
For carriers, the best strategy is disciplined lane selection and accurate cost calculation.
For brokers, it is carrier relationships, verification, and realistic pricing.
For shippers, it is securing dependable capacity before another disruption exposes how little excess truck supply remains.
Data Note
Fuel prices in this report use the U.S. Energy Information Administration’s July 20, 2026 survey, released July 21. The next federal diesel update is scheduled for July 28.
Spot-market data primarily reflects DAT’s seven-day measurements covering the week of July 13 through July 19 and market reports published July 21–22. All-in rates include fuel, while linehaul rates exclude fuel. Individual lanes can vary significantly based on origin, destination, equipment, length of haul, appointment requirements, commodity, and local truck availability.